Audit of energy saving solutions
Any audit is a first step towards clarity and solutions. Traditionally, resource and energy efficiency solutions are very complex and cover many areas. Approached from only one angle, the information is incorrect, the results are inaccurate, and instead of improving the situation, the end result may even worsen the situation.
The audit begins with the collection of source data, in the framework of which it is important for the contracting authority to provide source data that is as accurate and up-to-date as possible. The more accurate the source data, the more accurate the payback periods, energy cost estimates and solution costs calculated in the final audit.
Mapping and measurements
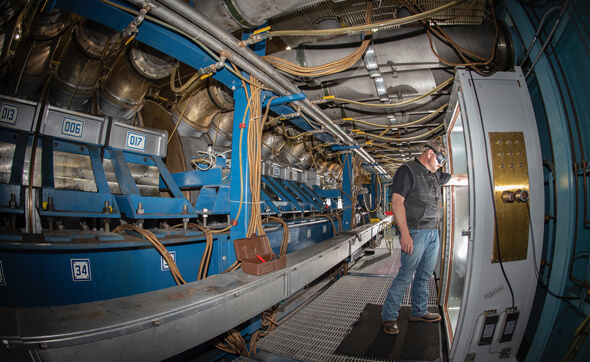
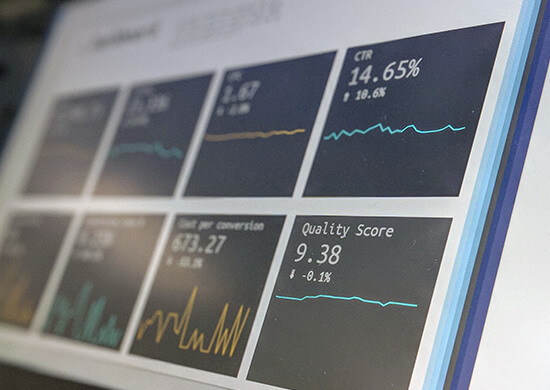
In order to analyse and map the building data, the relevant experienced engineers will be involved in the project, who will work through the source information and, during the mapping, assess the current state of the technical systems and identify solutions to improve the existing situation. Unlike a classic energy audit, the audit of energy saving solutions involves various measurements, including indoor climate (temperature, CO2, relative humidity), light levels in rooms and workplaces, random thermography, faucet and shower water consumption, electricity consumption and measurements of the proportion compressed air leakage or already mapping in industrial plants. Based on the results, solutions with a reasonable payback period are prepared for the customer, which, depending on the field, help to save 40-90% of energy costs.
Training and implementation
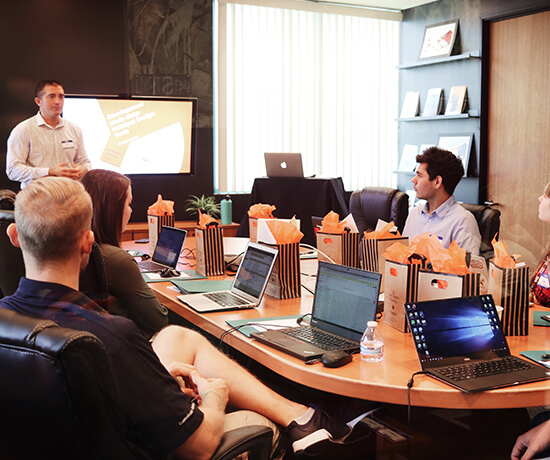
The audit service includes the presentation of a summary of the completed work and training on the proposed solutions so that our client does not receive another classic energy audit, which typically establishes the facts of the current situation, but does not offer a specific solution, payback periods and action plan.
The audit of DeltaE Engineering provides the client with specific solutions to improve the condition of the technical systems and proposes a further work plan based on the priorities. In addition, the audit provides a thorough overview of the energy consumption of each complex and the trends in electricity consumption.
After the contracting authority’s training, the client can decide whether to invest in the implementation of the solutions oneself or with our help. We are ready to finance our own solutions. We are so confident about savings!
The whole process of implementing energy saving solutions
Schedule of the usual
audit process
Stage |
Timeline |
| Collecting source data | 1. – 2. week |
| Conducting inspections | 3. week |
| Carrying out measurements | 3. – 4. week |
| Preparation of the audit report | 4. – 6. week |
| Presentation and training | 7. week |
| Confirming financing model | 8. week |
| Implementation of solutions | 8. week |
Average results of energy saving solutions audits
Field |
Savings |
Payback |
| Electricity | 10-15% | 2 – 4 yrs |
| Lighting | 70-90% | 2 – 3 yrs |
| Water saving | 20-30% | 1 – 2 yrs |
| Heating-ventilation-cooling | 20-30% | 2 – 5 yrs |
| Building automation | 20-40% | 2 – 5 yrs |
| Compressed air and industrial solutions | 20-40% | 1 – 2 yrs |
| Solar energy | – | 6 – 9 yrs |
Energy saving solutions audit vs energy audit
| DeltaE audit | Energy audit | |
|---|---|---|
| Energy cost mapping | ||
| Energy cost analysis | ||
| Preparation of recommendations | ||
| Technical mapping of utility systems | ||
| Carrying out thorough measurements | ||
| Developing the solutions | ||
| Establishing an implementation plan | ||
| Client training | ||
| Development of the financing model |
Field references
Estanc AS
- Object production complex
- Size of object 11 500 m2
- Average payback period 3,5 yrs
- Number of solutions 13
- Estimated investment 185 k€
Acino Estonia OÜ
- Object production complex
- Size of object 3 000 m2
- Average payback period 5 yrs
- Lahenduste arv 13
- Hinnanguline investeering 145 k€
Clyde Bergemann Eesti AS
- Object production complex
- Size of object 7 300 m2
- Average payback period 2 yrs
- Number of solutions 14
- Estimated investment 800 k€

Eesti Post AS
- Object office building
- Size of object 21 000 m2
- Average payback period 3,8 yrs
- Number of solutions 9
- Estimated investment 350 k€
Neiser Group AS
- Object production complex
- Size of object 11 200 m2
- Average payback period 6,8 yrs
- Number of solutions 17
- Estimated investment 450 k€
Värska Vesi AS
- Object production complex
- Size of object 7 500 m2
- Average payback period 4,9 yrs
- Number of solutions 15
- Estimated investment 130 k€

Loginvest OÜ
- Object logistics center
- Size of object 33 000 m2
- Average payback period 2,5 yrs
- Number of solutions 17
- Estimated investment 440 k€
Harju Elekter Elektrotehnika AS
- Object production complex
- Size of object 9 300 m2
- Average payback period 3,2 yrs
- Number of solutions 10

Järva vald
- Object school
- Size of object 7 800 m2
- Average payback period 3,0 yrs
- Number of solutions 16
- Estimated investment 120 k€
Raum OÜ
- Object production complex
- Size of object 4 000 m2
- Average payback period 4,5 yrs
- Number of solutions 14
- Estimated investment 50 k€

Lõuna-Eesti Haigla AS
- Object hospital
- Size of object 20 000 m2
- Average payback period 5,25 yrs
- Number of solutions 14
- Estimated investment 725 k€

Karlskroona OÜ
- Object warehouse complex
- Size of object 5 000 m2
- Average payback period 3,25 yrs
- Number of solutions 8
- Estimated investment 78 k€

RealWAY OÜ
- Object office building
- Size of object 3 700 m2
- Average payback period 4,25 yrs
- Number of solutions 12
- Estimated investment 150 k€
MTG GRUPP OÜ
- Obejct hospital
- Size of object 8 500 m2
- Average payback period 4,9 yrs
- Number of solutions 10
- Estimated investment 360 k€
